
Mining 911 Emergency calls using Apache Hadoop
This study started in order to practice the concepts learnt at BigData Techcon Boston, 2013. It uses Apache Hadoop and Python as tools to get the job done.
Self-moved by my internal curiosity, The goal is to understand the flow of the 911 calls for a given time-period. The 911 industry doesn’t have a huge level of call traffic but it demands a strictly well-engineered network design. Knowing how our servers are being used is a must. This study will help to understand the VoIP traffic of 911 Emergency calls.
This is @luismartingil solution. More info here.
Where am I getting the dataset from?
Dataset is taken from different random-selected SIP b2buas from our IP network. These servers route calls based on different SIP headers and databases using the Session Initiation Protocol. Obviously all the SIP messages they send/receive are properly logged with the internal state of the servers. Today I’ll take some log files from these servers and have fun with them.
Log files have lines with the following structure: {INVITE sip:number@domain:5060 SIP/2.0, SIP/2.0 100 Trying, SIP/2.0 180 Ringing, SIP/2.0 183 Session Progress, SIP/2.0 200 OK, BYE sip:domain SIP/2.0}.
What stats am I looking for? {1, 2, 3}
1) Overall days.
2) Calls for the given days of the week.
3) Calls for the given hour of the day.
Defining the problem in Hadoop
We have to properly model our solution in the Hadoop world, this is required for Hadoop to understand what we are trying to do. I consider this step as the hardest one. If we can’t model our solution into a Hadoop’s valid input we won’t be able to use it and to get the benefits of the parallelism and distribution in the cluster.
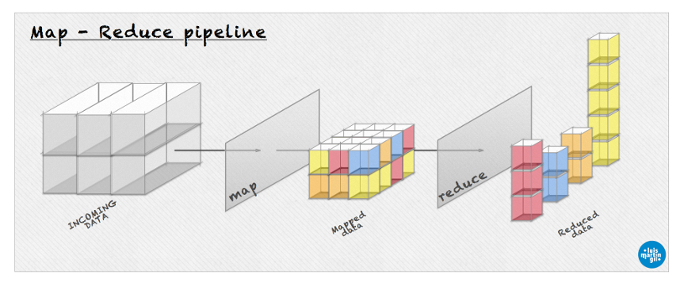
Two different methods need to be defined: map and reduce. I love drawings, let’s visualize this (high resolution here):
Main idea of my solution is to let the map ‘bucketize’ (make buckets) the input and let the reduce count them all.
a. Mapping
-
map gets the log files from our SIP servers as input and generates keys-value pairs. The concept is very similar to creating different hash functions. Our keys are defined differently based on the nature of {1, 2, 3}.
-
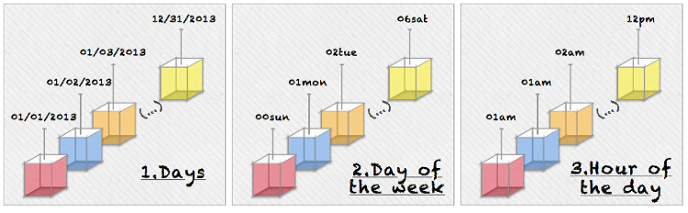
a1) Overall days, we want each day to count as a key. Mapper generates : 01/03/2013 1, 02/06/2013 1, 21/01/2013 1, 01/09/2013 1, 01/11/2013 1, …
-
a2) Calls for the given days of the week, each day of the week will be a key : 06sat 1, 02tue 1, 01mon 1, 00sun 1, 00sun 1, 06sat 1, …
-
a3) Calls for the given hour of the day, mapper will generate key-value pairs based on the time of the day : 03am 1, 02pm 1, 02am 1, 06am 1, 04am 1, 02pm 1, 02pm 1, 11pm 1, …
-
Key assignation process based on buckets
b. Reducing
-
reduce properly joins map’s output and provides the final result. In our scenario it just merges the key-value pairs and sums the values associated to a key. In this case it’s the same for {1, 2, 3}.
-
b1) Overall days, reducer generates : 01/03/2013 D1, 02/06/2013 D2, 21/01/2013 D3, 01/09/2013 D4, 01/11/2013 DN, …
-
b2) Calls for the given days of the week, reducer generates : 06sat W1, 02tue W2, 01mon W3, 00sun W4, 00sun W5, 06sat WN, …
-
b3) Calls for the given hour of the day, reducer generates : 03am H1, 02pm H2, 02am H3, 06am H4, 04am H5, 02pm H6, 02pm H7, 11pm H8, …
-
Are there more solutions to this problem?
- Yes. I consider myself a learner in the Hadoop world, there might be better Hadoop implementations to this easy-problem but this is the approach I came up with. It doesn’t mean that is the only one by any means. You can have more information about the MapReduce model here.
Does Hadoop cluster look always the same?
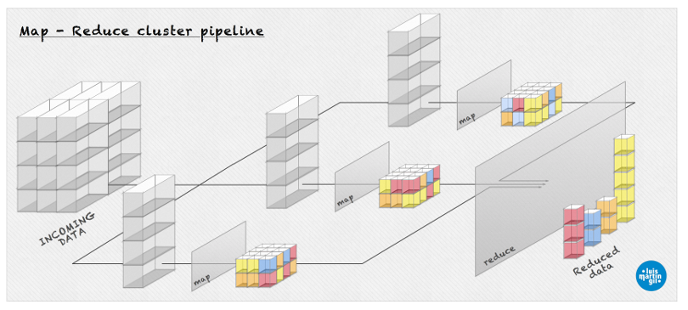
- No. In a real cluster map-reduce takes place in a multi-level hierarchy. This picture gives an idea of what it could look like in a more realistic scenario (high resolution here).
Where are your mapper/reducers?
- Here you can find all the source code. Mapper and reducer are both implemented in Python. Mapper {1, 2, 3} is selected using an env variable, which makes things easy when using the BASH script to populate all the jobs with one command.
Doing the job. Getting the results
I’m using Cloudera quickstart Virtual Machine 4.4.0-1 with Hadoop 2.0.0-cdh4.4.0 for the cluster simulation. You can have a quick look to the commands used here. Basically I copied the files to be mined into the HDFS file system and executed the run.sh. Results were copied back from the HDFS to the VM by the script. Here is an output of one of the jobs. As you can see the reducing process starts before the mapper is done.
14/02/01 23:49:17 INFO streaming.StreamJob:  map 0%  reduce 0%
14/02/01 23:49:32 INFO streaming.StreamJob:  map 3%  reduce 0%
(...)
14/02/01 23:53:06 INFO streaming.StreamJob:  map 93%  reduce 15%
(...)
14/02/01 23:53:24 INFO streaming.StreamJob:  map 100%  reduce 50%
14/02/01 23:53:34 INFO streaming.StreamJob: map 100% reduce 100%-
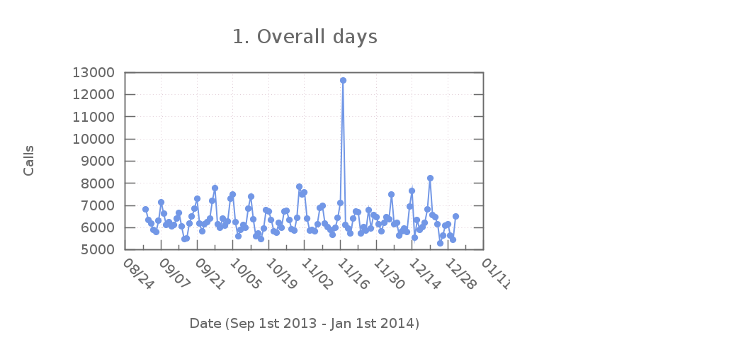
1) Overall days
-
Last months each b2bua instance has been getting an aprox average of 6500 calls per day. So some groups of counties of Indiana have been getting around 4 calls per minute. This number could sound ridiculous from the carriers’ perspective, in the 911 world is a valid number though.
-
There is a relevant peak in the plot. On November 17th 2013 each instance got around 12600 calls, which almost doubled the normal traffic of the servers. What did happened that day? We had one of the worst weather conditions of the last years. Tornados were all over the midwest of the USA, hitting hard some counties in Indiana. Tornado outbreak. I’m glad we did help the people. Very interesting.
-
-
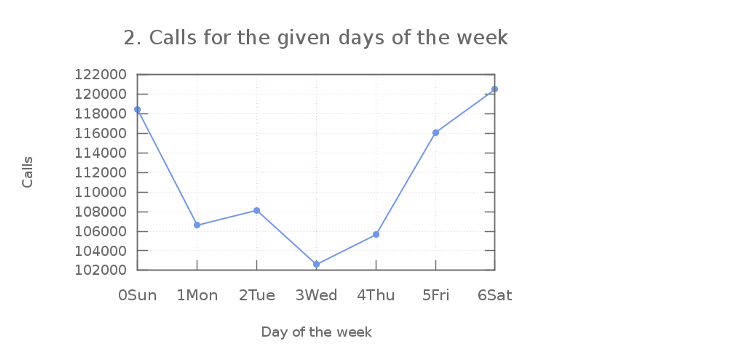
2) Calls for the given days of the week (From September 1st 2013 - Jan 1st 2014)
- Social interactions are pretty defined in the next plot. Weekends are pretty much the hottest points in the 911 call-generation for a given week. That’s probably what all of us guessed, but it’s always nice to backup the thoughts with the real-data.
-
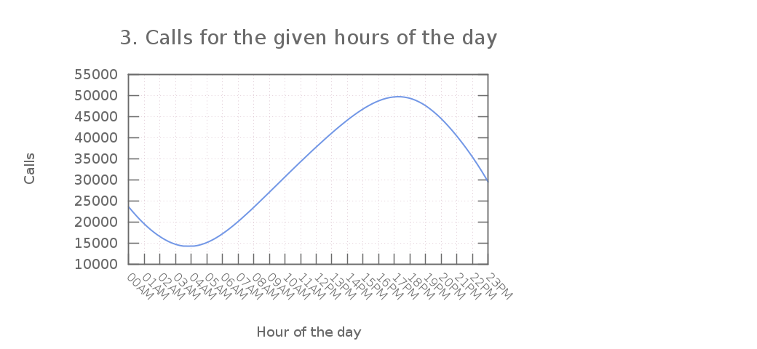
3) Calls for the given hour of the day (From September 1st 2013 - Jan 1st 2014)
- Next plot also makes a lot of sense. Being 5pm the rush hour and people usually sleeping during night (funny), this sinusoidal wave perfectly defines the normal schedule for the people interactions (and 911 call-generation).
( Graphs are made using Gnuplot and tweaked with Gimp. Open source powered! )
Conclusions
-
People’s habits are described in these plots, also events like the tornado outbreak are pointed in our data. Results are reasonable and pretty logical. Using technology to approach these studies is pretty neat. Learnt several things in the mining side as well. Very interesting project overall.
-
I would like to thanks INdigital, my actual employer. I’m proud to be part of a team of devs that are making the 911 Emergency technology better. We are doing a job that has a great impact in the society making it better for the people to help each other.
Did I really need to use Hadoop for this?
- For files of this size of this configuration, obviously no. I can easily do this using a terminal command piping the map and reduce myself. We start to get the benefit of Hadoop using a real cluster and mining X files Y times bigger (X, Y will be something interesting to research). This is an enjoyable approach to do the job as the same time we play with the basic technologies and concepts of big data. Obviously this could be a good starting point as a research for a valid scalable solution.